The Requirement for a Visual Analytics Dashboard
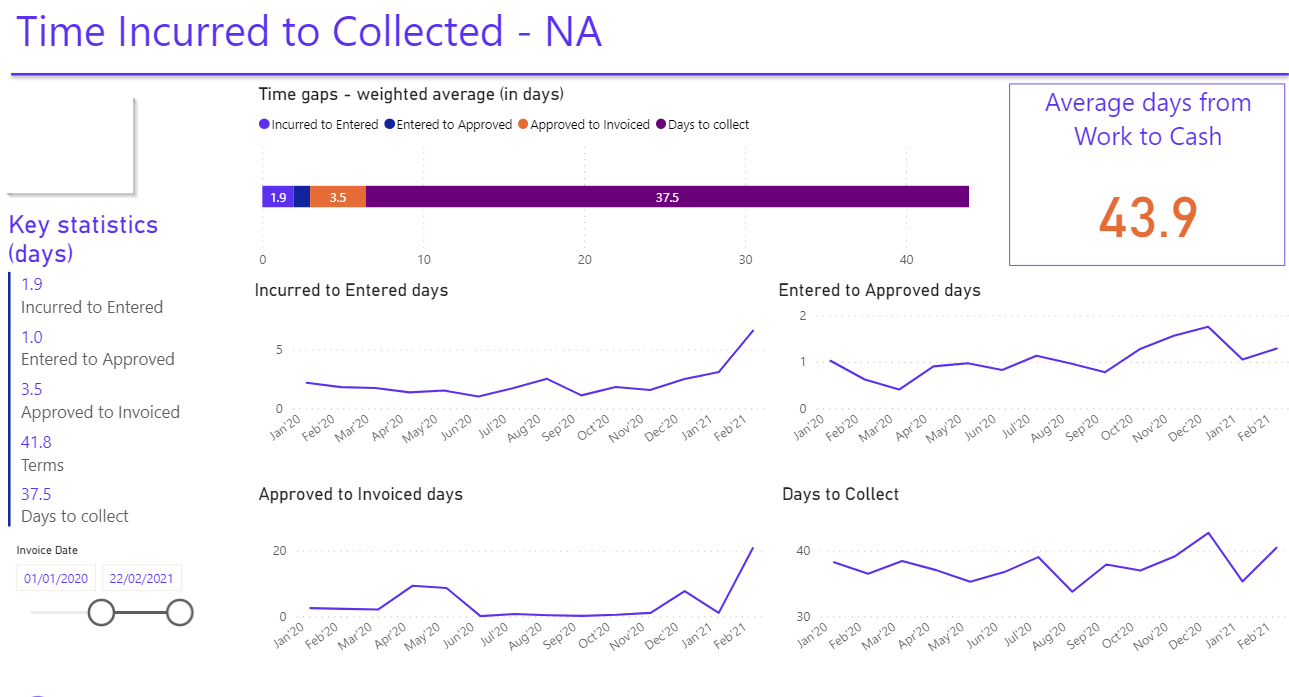
This Isosceles client wanted to reduce working capital in the business. They felt they could be more efficient with cash but had never been able to pinpoint the areas to focus on with concrete data.
Similarly, the management team also wanted to enhance and overhaul existing reporting models, which analysed how well-utilised staff were on client projects and how that was converting into revenue.
To do this, they needed to analyse global revenue by region, line of business and resource at a very granular level. They also needed to gain a definitive data-driven understanding of key revenue drivers, which would empower them to feedback into the business planning and decision-making process.
They required an experienced partner to model to undertake this ambitious project and present this information through an interactive visual analytics dashboard.
The Client
Isosceles’ private equity-backed client is a global professional services company specialising in data migration and transformation services.
Its service combines an ERP product, AI and machine learning, and its consultants’ extensive big data expertise, helping its clients make the most of their data assets.
The company has nearly 1,000 data specialists in over 20 offices around the world.
As the potential of big data has changed, the client’s core focus has evolved to include data quality, data replication, information governance, and data strategy.
Why Isosceles?
Isosceles has a positive track record with this client, having supported them with various projects over the last seven years.
“In recent years, Isosceles has expanded its Microsoft Power BI capabilities and invested in the development of a specialist technology team. Our accounting, finance and HR professionals have worked with this long-standing client and its management team on a range of complex projects over a seven-year period. This experience has given Isosceles a unique opportunity to develop a granular understanding of the client’s profit and cost drivers and support them with our technical skills, systems knowledge, and data analysis expertise. I am particularly proud of how our technology team has supported the client’s management team in critical business decision-making through rigorous Power BI modelling and analysis. I am excited about the potential of Power BI and how it can be deployed across our entrepreneurial client base.” Mike O’Connell, CEO, Isosceles
The Visual Analytics Solution
Isosceles’ technology team worked with the client’s management team during the COVID-19 global pandemic to deploy Microsoft Power BI models and interactive visual analytics dashboards.
Working capital analysis
On the working capital solution, the client captures the key dates in the end-to-end cycle from task performance through timesheets to invoices and ultimately to cash collection. Then, Isosceles’ solution transforms the raw data, using Power BI, into a reporting suite that enables the client to identify key points within the entire working capital cycle where efficiencies could be realised.
Global revenue and utilisation
A similar process is followed on the global revenue and utilisation analysis; the client’s system tracks operational data. Then, Isosceles feeds this information into Power BI to generate key revenue and utilisation insights. As a result, our solution continues to deliver easily consumable global revenue and utilisation reports into the hands of management, thereby enabling the leadership team to unlock the desired insights from a large volume of data.
The Result
Against the backdrop of current Coronavirus challenges, Isosceles’ implementation of Microsoft Power BI delivers through a visual analytics dashboard:
- Detailed and granular views of global revenue and utilisation across the company. This has allowed management to feedback into the decision-making process.
- A breakdown of the entire working capital cycle. As a result, specific areas of focus are now highlighted, enabling the client to identify and rectify issues and drive down the time from completion of work to receipt of payment, thereby reducing the amount of cash tied up in the business.