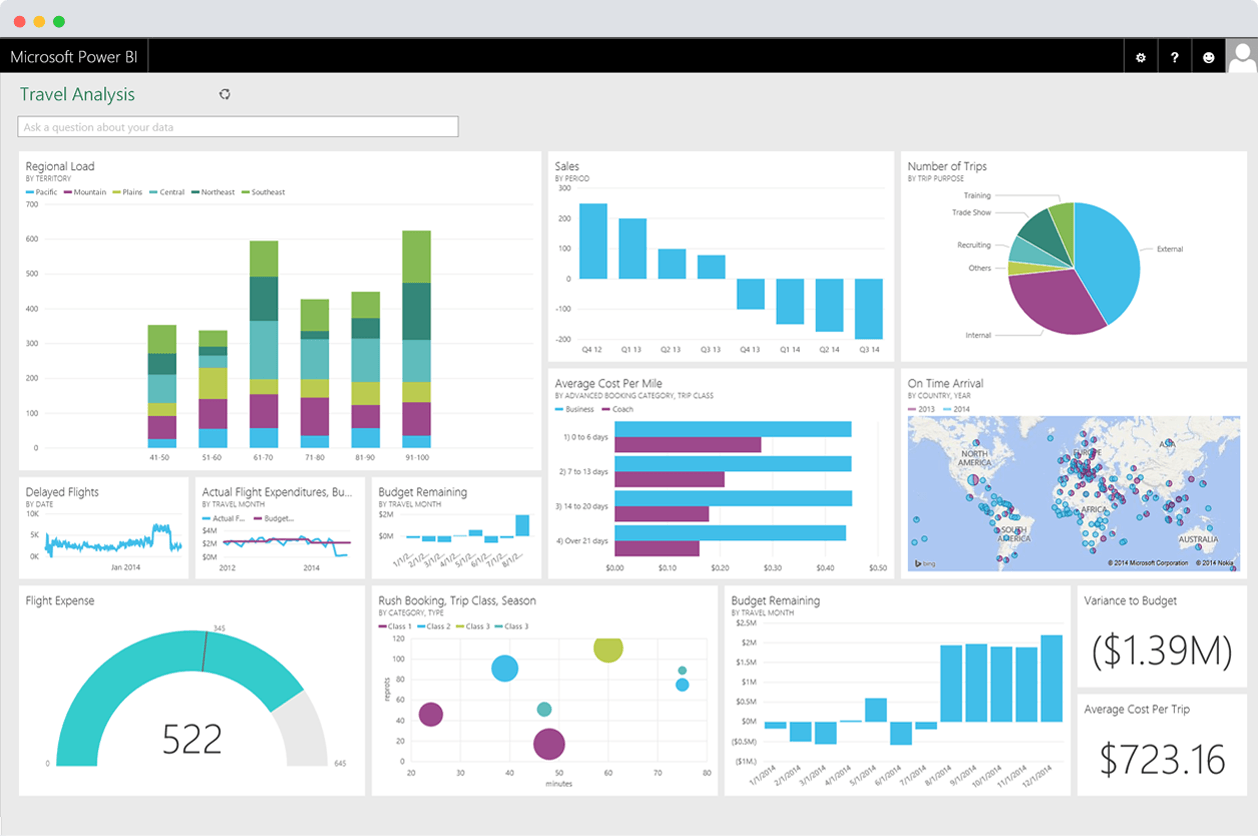
When it comes to data, the faster that leadership teams have access to easily consumable and sharable management information, the faster they can use it to drive change.
Microsoft Power BI allows users to quickly connect multiple data sources, prepare information, manipulate key metrics, and securely share interactive and immersive insights with other members of the team.
In our latest blog, we explore the potential of this application and highlight the importance of big data in shaping decisions across the business, and outline how Isosceles have used the software across our entrepreneurial client base.
Estimated reading time: 3.5 minutes.
For years accountants have been using complex Excel models and pivot tables to analyse large volumes of data.
However, accountants everywhere are familiar with the age-old problems associated with Excel:
- Large spreadsheets are temperamental, unwieldy and break easily.
- Business-critical models become slaves to the author of the model.
- It is often difficult to refresh the data whilst also maintaining the integrity of the model; sometimes a systems accountant will encounter the odd hardcoded cell from a previous user.
- It is a laborious effort to share and distribute the 60MB model to the people that need the analysis quickly and who may have limited technical expertise.
Business intelligence tools were once the prerogative of large companies with deep pockets and a room full of data analysts.
Power BI explained
Power BI is a collection of software products, apps, and connectors that combine to convert multiple streams of data into interactive insights. It consists of several core elements designed to make business insights accessible and management infomation sharable:
- Power BI Desktop
- Power BI Service
- Power BI Mobile Apps
Related | Why chose Power BI as your Business Intelligence Platform?
How is Power BI deployed?
It can be deployed in several areas of the business to enable users to connect to hundreds of data sources on-premises or in the cloud, such as Excel, Salesforce, Google Analytics, social networks and IoT devices.
Having the ability to visualise such a wealth of data points allows end-users to consume dynamic real-time management information.
However, the advent of data analytics platforms, and in particular the release of Microsoft Power BI in 2014, democratised the world of analytics, placing significant analytics capability within the mandate of a systems accountant.
For example, Power BI can convert business data into smarter business decisions by enabling users to:
- Create dashboards that deliver a granular view of the business.
- Control how data is stored and manipulated.
- Determine how future content can be packaged and delivered.
- Present dynamic information powered by a wealth of data points.
- Consume live interactive insights and immersive visuals.
However, the use of Power BI across the business may depend on the role of the user. For example,
- One user might use the Power BI service to view reports and dashboards.
- A user specialising in creating business reports might use Power BI Desktop, Power BI Report Builder or Power BI service.
- Salespeople might use the mobile app to monitor the progress of sales whilst on the move.
- Meanwhile, a developer might use Application Programming Interfaces to embed dashboards and reports into modified applications.
Step-by-step: Power BI workflow
The following workflow outlines how the three core elements of Power BI work:
Step 1 – Connect data sources in Power BI Desktop and build a report.
Step 2 – Publish the report from Power BI Desktop to the Power BI service.
Step 3 – Share it so those members of the team using the Power BI service and Power BI mobile apps can interact with the report.
Why use it for management information
When it comes to the presentation and analysis of management information, Microsoft Excel has long been a widely used and accepted application.
However, users of Excel will be familiar with the lengthy and sometimes restrictive process of data manipulation and the static nature and lack of depth in its delivery of information to end-users.
Even small and medium-sized companies (SMEs) quickly outgrow Excel’s capabilities.
Many entrepreneurial businesses graduate to the Power BI platform and deploy it across the business. As a business grows it begins to amass data. At the same time, it needs to store, manipulate, and visualise this information. Even if it has a data lake or data room, senior management teams still need to transform this raw data into informed business decisions.
Power BI allows users to:
- Record the steps of manipulation to automate the process. This is known as Extract Transform and Load. Data is rarely ‘clean’ and nearly always needs a degree of shaping before it is ready to be converted to reports.
- Minimise manual errors by streamlining the data preparation process.
- Connect directly to live data sources for real-time information.
- Distribute the information to end-users in an accessible format.
How are we using the platform?
We believe there is a need for entrepreneurial businesses to run data more effectively and efficiently.
Power BI modelling provides management teams with access to timely, relevant, and important business data which can then be used to assess a range of business areas and rectify any issues.
Finally, our several decades of combined experience has enabled us to approach data analysis projects from a commercial and strategic perspective, rather than the conventional technology consultant whose pure IT or data analysis pedigree may omit broader implications of the data.
Related article | How technology is reshaping the future of the finance department